Business Cycle Dating
Turning points of the mexican business cycles, 1980-2020
| Recesión | Expansión | Ciclo | |||||
|---|---|---|---|---|---|---|---|
| Ciclos desde 1980 |
Inicio |
Fin (Valle) |
Duración (meses) |
Inicio |
Fin (Pico) |
Duración (meses) |
Duración (meses) |
| 1 | Diciembre 1981 |
Junio 1983 |
19 | Julio 1983 |
Septiembre 1985 |
27 | 46 |
| 2 | Octubre 1985 |
Diciembre 1986 |
15 | Enero 1987 |
Noviembre 1994 |
95 | 110 |
| 3 |
Diciembre 1994 |
Mayo 1995 |
6 |
Junio 1995 |
Septiembre 2000 |
64 |
70 |
| 4 |
Octubre 2000 |
Enero 2002 |
16 |
Febrero 2002 |
Junio 2008 |
77 |
93 |
| 5 |
Julio 2008 |
Mayo 2009 |
11 |
Junio 2009 |
Mayo 2019 |
120 |
131 |
| 6 |
Junio 2019 |
Mayo 2020 |
12 |
Junio 2020 |
|
|
|
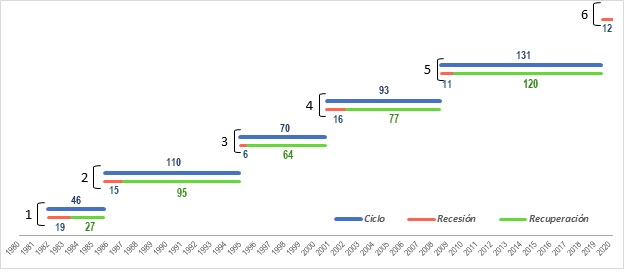
The following graph shows the chronology and duration, in months, of the different cycles and their respective phases. It is then that the CFCEM identified 5 complete cycles plus a recession corresponding to ta new cycle. The average duration of the complete cycles was 90 months. The shortest cycle, from 1981 to 1985 lasted 46 months and the longest one, from 2008 to 2019 spanned 131 months. As is often the case when following the classical cycle approach, recessions in general were shorter than the recoveries, with the average duration of recessions being 13.2 months, while that of recoveries was 76.6 months. The shortest recession was the one from 1994 to 1995 which lasted for only 6 months, while the longest was the one from 1981 to 1983 that lasted 19 months. Regarding the recoveries, the shortest was the one from 1983 to 1985 which took 19 months, while the longest one was from 2009 to 2019 which lasted 120 months.
Chronology and duration of business cycles and its phases in the Mexican economy, 1980-2020
